Sydney
Now: 20.2 °C
Today: 22 °C  Partly cloudy.
Tonight: 14 °C
Tomorrow: 23 °C
Partly cloudy.
Tonight: 14 °C
Tomorrow: 23 °C  Shower or two.
Today, Monday: Partly cloudy. Slight chance of a shower, most likely at night. Winds southerly 20 to 30 km/h tending southeasterly in the middle of the day then becoming light in the late evening.
| Temperature | 20.2 °C | |
| Feels like | 15.6 °C | |
| Wet bulb temp. | 14.5 °C | |
| Minimum temp. | 16.7 °C | 5:54am |
| Maximum temp. | 21.1 °C | 2:21pm |
| Dew point | 9.5 °C | |
| Humidity | 50% | |
| Wind |  24 km/h 24 km/h | |
| Strongest gust | 56 km/h | 5:05am |
| UV index | 5.8 | High |
| Pressure | 1014.4 hPa | |
| Rain since 9am | 0.0 mm |
Sydney Airport at 3:00pm.
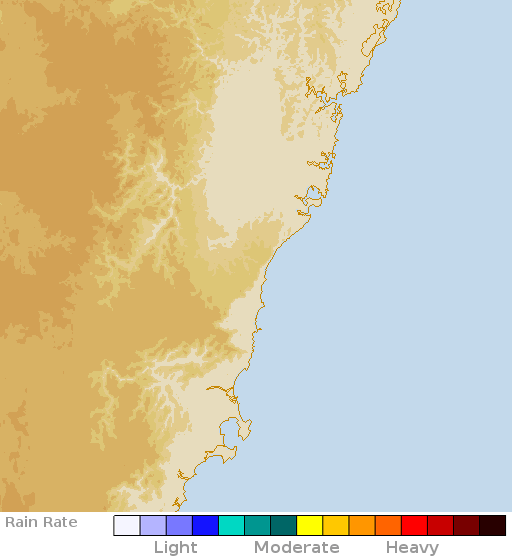
Radar


UV index
| Now measured | Now forecast | Maximum measured | Maximum forecast |
| 5.8 | 5.5 | 9.7 | 8.9 |
| High | High | Very high | Very high |
| 12:58pm | 12:39pm |
| Moderate or above | Forecast | 8:52am–4:27pm |
| Measured | 8:47am– |
Last 72 hours
Today
| Dawn | Sunrise | Sunset | Dusk |
| 5:35am | 6:01am | 7:18pm | 7:44pm |
Tomorrow
| Dawn | Sunrise | Sunset | Dusk |
| 5:33am | 6:00am | 7:18pm | 7:45pm |
Recent days
| Date | Min. | Max. | Rain |
| Mon 26 Oct | 17.2 °C | 1.2 mm | |
| Sun 25 Oct | 19.4 °C | 32.1 °C | 0 mm |
| Sat 24 Oct | 17.5 °C | 25.5 °C | 0.2 mm |
| Fri 23 Oct | 17.3 °C | 23.9 °C | 10.4 mm |
| Thu 22 Oct | 18.4 °C | 23.7 °C | 0 mm |
| Wed 21 Oct | 16.1 °C | 24.9 °C | 0 mm |
| Tue 20 Oct | 14.8 °C | 23.6 °C | 0 mm |
| Mon 19 Oct | 13.9 °C | 23.0 °C | 0 mm |
Space weather
Kaus seven day history
Next 36 hours
| Time | 2pm | 5pm | 8pm | 11pm | Tue 2am |
5am | 8am | 11am | 2pm | 5pm | 8pm | 11pm |
| Temperature (°C) | 22 | 20 | 19 | 18 | 16 | 15 | 17 | 22 | 23 | 22 | 20 | 18 |
| Chance of rain | 0% | 0% | 10% | 20% | 20% | 10% | 20% | 40% | 30% | 20% | 40% | 10% |
| Median rain (mm) | 0 | 0 | 0 | 0 | 0 | 0 | 0 | 0 | 0 | 0 | 0 | 0 |
| Wind speed (km/h) | 35 | 28 | 20 | 19 | 13 | 9 | 9 | 9 | 19 | 26 | 13 | 13 |
| Wind direction | |
|
|
|
|
|
|
|
|
|
|
|
| Dew point (°C) | 9 | 9 | 9 | 10 | 11 | 11 | 11 | 9 | 10 | 11 | 13 | 11 |
Next week summary
| Today Mon 26 Oct |
Tue 27 Oct |
Wed 28 Oct |
Thu 29 Oct |
Fri 30 Oct |
Sat 31 Oct |
Sun 1 Nov |
|||||||||
|
|
|
 |
|
|
|
|||||||||
| Partly cloudy. | Shower or two. | Mostly sunny. | Sunny. | Partly cloudy. | Shower or two. | Shower or two. | |||||||||
| Max. (°C) | 22 | 23 | 25 | 24 | 25 | 26 | 27 | ||||||||
| Min. (°C) | - | 14 | 13 | 13 | 16 | 17 | 18 | ||||||||
| Any rain | 20% | 70% | 10% | 5% | 10% | 70% | 70% | ||||||||
| Rain (mm) | 0 | 0–4 | 0 | 0 | 0 | 0–1 | 0–9 | ||||||||
| 8am | 2pm | 8am | 2pm | 8am | 2pm | 8am | 2pm | 8am | 2pm | 8am | 2pm | 8am | 2pm | ||
| Wind (km/h) | - | 35 | 9 | 19 | 17 | 22 | 11 | 17 | 7 | 26 | 13 | 20 | 13 | 20 | |
| Wind dir. | - | |
|
|
|
|
|
|
|
|
|
|
|
|
|
| Dew pt. (°C) | - | 9 | 11 | 10 | 6 | 5 | 8 | 9 | 13 | 12 | 15 | 15 | 16 | 15 | |
Complete forecast
Today, Monday 26 October
Partly cloudy.
Maximum: 22 °C
20% chance of rain
Partly cloudy. Slight chance of a shower, most likely at night. Winds southerly 20 to 30 km/h tending southeasterly in the middle of the day then becoming light in the late evening.
Sun protection 8:50am to 4:20pm, UV Index predicted to reach 9 [Very High]
Tomorrow, Tuesday 27 October
Shower or two.
Minimum: 14 °C Maximum: 23 °C
70% chance of rain 0 to 4 mm
Partly cloudy. Medium chance of showers. Light winds becoming east to northeasterly 15 to 25 km/h in the early afternoon then becoming light in the evening.
Wednesday 28 October
Mostly sunny.
Minimum: 13 °C Maximum: 25 °C
10% chance of rain
Mostly sunny. Winds west to southwesterly 15 to 25 km/h tending south to southwesterly during the day then becoming light during the evening.
Thursday 29 October
Sunny.
Minimum: 13 °C Maximum: 24 °C
5% chance of rain
Sunny. Light winds becoming easterly 15 to 20 km/h during the afternoon then becoming light during the evening.
Friday 30 October
Partly cloudy.
Minimum: 16 °C Maximum: 25 °C
10% chance of rain
Partly cloudy. Light winds becoming northeasterly 20 to 30 km/h during the day.
Saturday 31 October
Shower or two.
Minimum: 17 °C Maximum: 26 °C
70% chance of rain 0 to 1 mm
Partly cloudy. High chance of showers. Light winds becoming northerly 15 to 25 km/h during the day.
Sunday 1 November
Shower or two.
Minimum: 18 °C Maximum: 27 °C
70% chance of rain 0 to 9 mm
Partly cloudy. High chance of showers. The chance of a thunderstorm. Light winds becoming southeasterly 15 to 25 km/h during the day.
Issued as 12:05pm. Next forecast at 4:20pm.
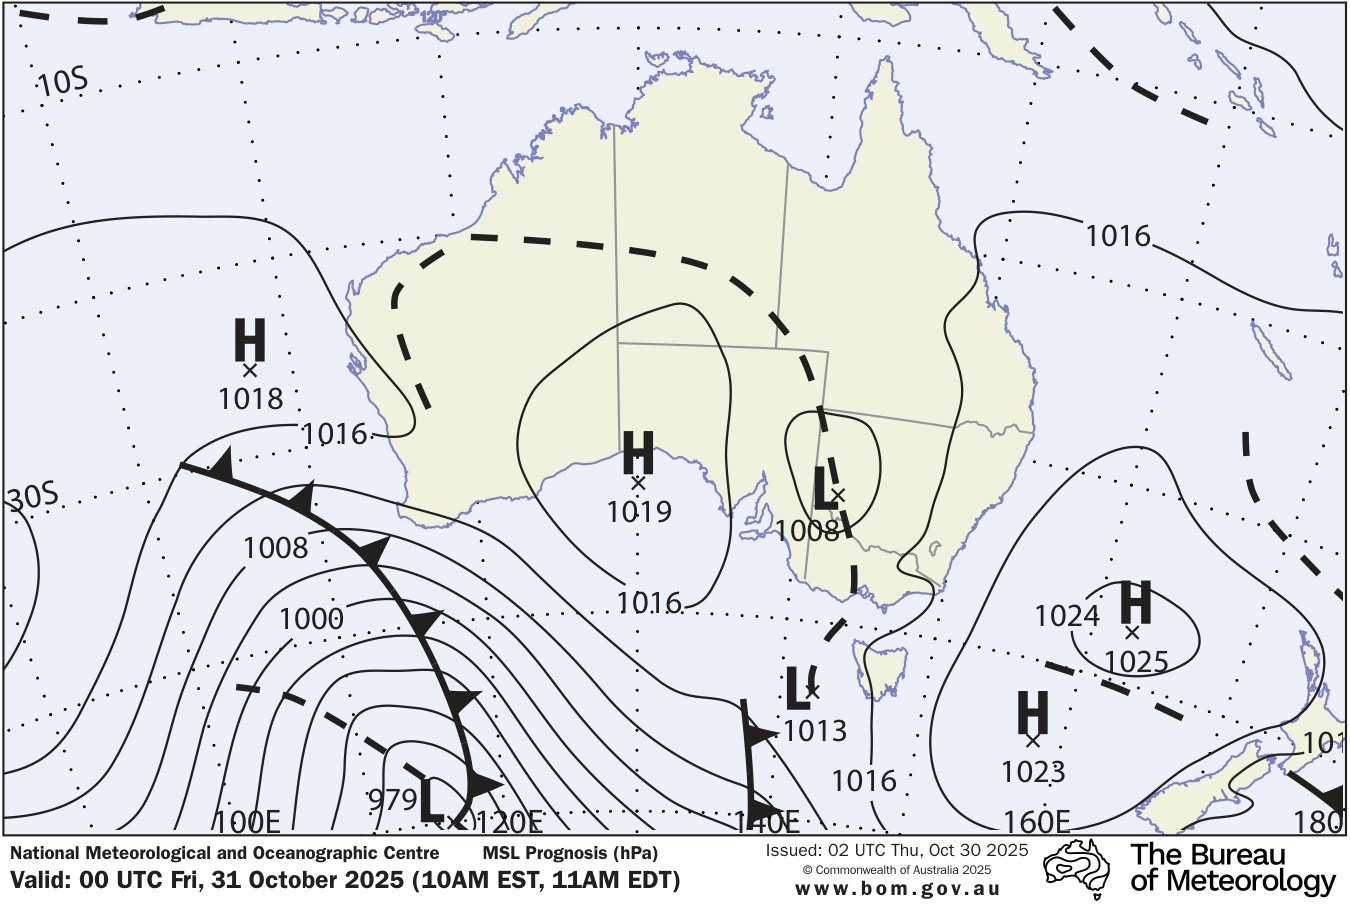
Weather situation
A trough is slowly moving east over NE NSW as a cold front sweeps the south of the state, bringing widespread unstable conditions. The cold front will move up the east coast today, with a ridge of high pressure building across the state from the west in the wake of the front.
Climate statistics
More details and data sources: